
Underwater • CoinMarketCap hackathon
The market's hidden cost basis.
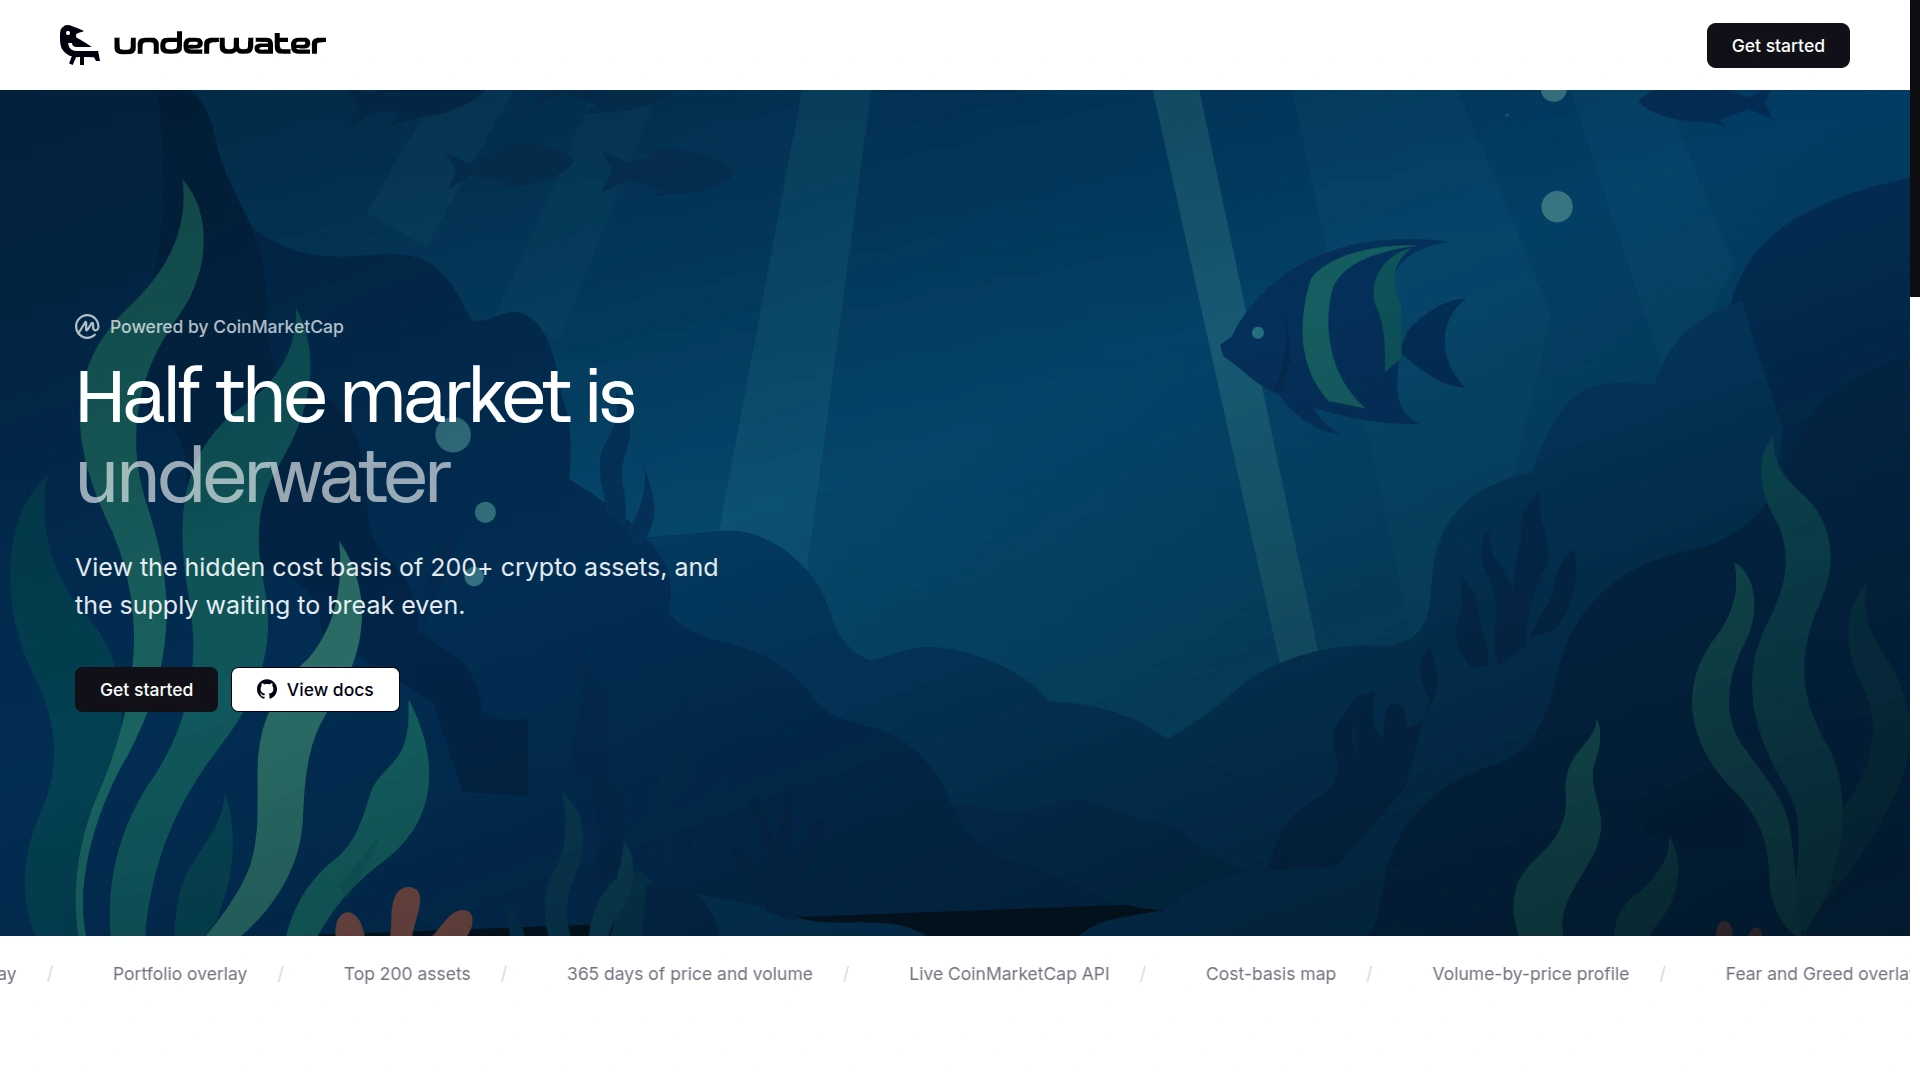
- Role
- Creator
- Timeline
- 2026
- Stack
- Next.jsTypeScriptTailwind v4
- Status
- LiveHackathon build
Overview
A price chart tells you the price. It never tells you what holders paid.
Underwater estimates the market's aggregate cost basis from one year of daily price and volume, then measures how much of the traded supply sits below the current price.
The tool covers the top 200 assets by market cap and rebuilds each one's volume-weighted average price over a 365-day window. The share of that volume that traded above today's price is the underwater supply. A high number means most of the year's trading happened higher than the current price: the average holder is down, and that is latent sell pressure.
Market underwater index
the trailing cost basis of the whole market, with a breadth line and a Fear and Greed overlay.
Cost-basis map
every asset placed by price against cost basis, and by underwater share. The bottom right is clean air; the top left is a wall of trapped holders.
Asset explorer and drawer
search, filter, and sort the universe, then open a volume-by-price profile and a peer comparison.
At the time of writing, 50 percent of 33.3 trillion dollars of traded volume is underwater, and 73 percent of the tracked universe trades below its cost basis.
The metric
Cost basis as a volume-weighted average price.
Every number on the dashboard comes from three quantities, computed from the same 365 daily points per asset.
The first is the volume-weighted average price: the sum of price times volume, divided by the sum of volume. That is the cost basis. The second is the underwater share: the volume that traded above today's price, divided by total volume. The third is pain depth: the average loss carried by the underwater portion.
The CoinMarketCap API returns price and 24-hour volume. It does not return realised entry prices or holder groups. VWAP is the standard proxy, and the dashboard states that plainly instead of implying ground truth.
Stablecoins are excluded, because a peg makes the metric meaningless. Assets with fewer than 120 daily points are dropped, so a freshly listed token cannot distort the aggregate.
Pipeline
From the API to a market-wide number.
The dataset build is a straight line: fetch, compute, aggregate, render.
Fetch
the top 200 assets from listings/latest, with price, volume, and sector tags.
History
365 daily points per asset from quotes/historical, batched 20 assets per request.
Compute
VWAP, underwater share, and pain depth per asset as pure functions in lib/underwater.ts.
Aggregate
a market index, a sector summary, and a portfolio view.
A full build costs about 715 credits and takes about 27 seconds. A snapshot is committed to the repository, so the demo runs without an API key and Refresh live is opt-in.
Billing is per returned row, and the plan caps history at 12 months. Both constraints shaped the design: batch the history calls, cache the result, and ship a snapshot.
Product
A dashboard built on hand-drawn SVG.
The dashboard is Next.js 16 and Tailwind v4, and every chart is hand-built SVG. There is no charting library.
That was deliberate. The visual language is specific, down to the cost-basis scatter and the volume-by-price profile, and a general-purpose charting library would have meant fighting its defaults for each one. Drawing the SVG directly kept the interaction model and the accessibility of the tooltips under our control.
Deep links make every view shareable. Each asset has a URL such as ?asset=DOGE, filters live in the query string, and the drawer has a copy-link button.
Source
Live demo and code.
Underwater was built for the CoinMarketCap hackathon in the data and visualisation track. The repository includes the metric engine, the reproducible dataset build, and the API feedback write-up.
View the live site